
TL;DR
- Price crawler software collects competitor pricing data continuously across products, channels, and markets, giving retailers the external market signals their pricing decisions depend on.
- Pricing analytics software measures the commercial outcomes of those pricing decisions, tracking whether prices are generating the margin, volume, and competitive position the strategy is designed to achieve.
- The two disciplines form a feedback loop: crawled market data informs pricing decisions, and pricing analytics measures whether those decisions produced the intended commercial result.
- Retailers who operate price crawling and pricing analytics as separate workstreams break that feedback loop, making competitive monitoring less actionable and performance measurement less attributable.
- Connecting the two into a single workflow gives pricing teams the market context to make better decisions and the performance data to know whether those decisions worked.
Competitive price monitoring and pricing performance measurement are often managed as separate functions in enterprise retail. The team responsible for tracking competitor prices operates independently from the team reviewing margin and revenue outcomes. Data flows from competitive monitoring into pricing decisions, and performance data flows from those decisions into finance reporting, but the connection between the two is rarely made explicit enough to create a genuine feedback loop.
Price crawler software is the market data input that informs pricing decisions. Pricing analytics software is the performance measurement layer that tells pricing teams whether those decisions achieved their commercial objectives. Together they form the feedback cycle that separates pricing teams who learn from their decisions from those who repeat the same mistakes across successive trading periods.
What Price Crawler Software Provides to Pricing Decisions
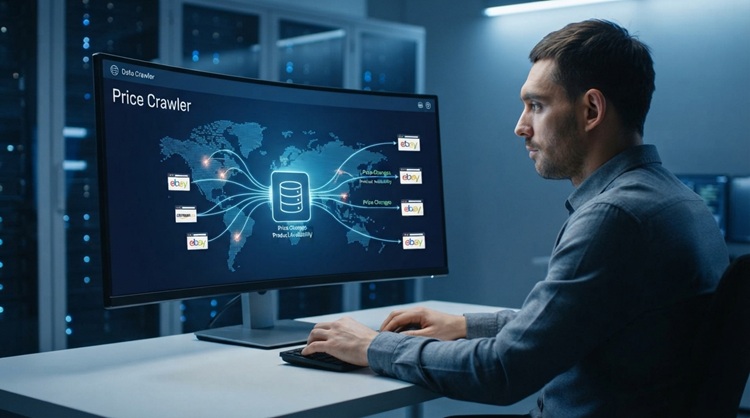
Price crawler software automatically collects competitor pricing data from across the web, covering retailer websites, marketplaces, and other channels where competitors present prices to customers. It structures that data by product, channel, and market, and delivers it at a refresh rate aligned to the competitive dynamics of each category the retailer monitors.
The data price crawler software delivers creates three types of actionable market signal for pricing teams:
Competitive price gaps requiring a response. When a crawler surfaces a competitor price significantly below the retailer’s current price on a key value item, the pricing team has a signal that requires evaluation: is this a genuine competitive threat that warrants a response, or a temporary promotional move that will reverse within days? The crawler provides the data. The pricing team provides the commercial judgment about whether and how to respond.
Market stability signals supporting margin recovery. When crawled data shows competitor prices holding stable or moving upward in a category, the pricing team has a signal that the market may support a price increase or a reduction in promotional depth. These upward pricing opportunities are frequently missed by retailers who monitor competitor prices reactively, looking for threats rather than opportunities.
Category-level competitive dynamics. Aggregated crawler data across a category reveals whether competitive pricing pressure is broadly distributed or concentrated in specific products or competitor relationships. A category where one competitor is aggressively discounting a handful of products presents a different pricing challenge than one where all competitors are uniformly reducing prices across the full range. Crawled data at category level gives the pricing team the context to calibrate their response to the actual competitive dynamic rather than reacting to individual price points in isolation.
The commercial value of crawled market data is realized at the point of the pricing decision it informs. Measuring whether that decision produced the intended commercial outcome is the function pricing analytics software performs.
What Pricing Analytics Software Measures and Why It Matters
Pricing analytics software tracks the commercial outcomes of pricing decisions against the objectives those decisions were designed to serve. It answers the question that crawled market data alone cannot: did the repricing decision produce the result the pricing team expected, and if not, where did it deviate?
In enterprise retail, pricing analytics operates across four measurement layers that together give pricing teams a complete picture of decision quality:
Margin performance by SKU and category. Did price changes protect or erode gross margin relative to target? This is the primary commercial outcome measurement for pricing decisions with a margin protection or recovery objective. Margin performance data at SKU level reveals where repricing is working as intended and where it is producing unintended margin compression.
Volume and revenue response. Did price changes generate the demand response the pricing team expected? A price reduction that was intended to drive volume uplift can be evaluated against actual sales velocity before and after the change. A price increase on a product with assumed inelastic demand can be evaluated against actual volume impact. Without this measurement, pricing teams have no reliable basis for improving their demand assumptions over time.
Price index movement. Did the retailer’s competitive position in each category move in the intended direction? A pricing strategy designed to maintain price parity on key value items should show a stable price index over time. A strategy designed to recover price premium on own-brand products should show a rising price index relative to the category average. Pricing analytics that tracks price index movement over time makes strategy execution visible rather than assumed.
Decision attribution. Which pricing decisions produced which commercial outcomes? Attribution is the hardest measurement challenge in pricing analytics because multiple factors affect sales performance simultaneously: promotional activity, seasonality, supply chain changes, and competitor moves all influence the outcome of any individual pricing decision. Pricing analytics software that controls for these confounding factors in its attribution modeling produces more reliable performance signals than one that attributes all outcome variation to price changes.
Building the Feedback Loop Between Crawling and Analytics
The feedback loop between price crawler software and pricing analytics software operates through a specific sequence that pricing teams need to build into their workflow rather than leaving it to emerge organically from separate monitoring and measurement processes.
Before a repricing decision, crawled market data provides the competitive context: where is the retailer’s current price relative to the market, what direction are competitors moving, and what is the competitive benchmark the new price needs to be calibrated against?
After the repricing decision, pricing analytics provides the outcome measurement: did the price change produce the margin, volume, and competitive position the team expected, and how does the actual outcome compare to the crawled market data that informed the decision?
The comparison between the expected outcome, based on competitive data, and the actual outcome, measured by analytics, is where pricing teams build the demand understanding that improves future decisions. A repricing response to a competitor price gap that produced lower-than-expected volume uplift suggests the product’s demand is less elastic than the competitive signal implied. That insight improves the team’s response logic for the next similar competitive move.
Competera’s platform connects both capabilities in a single system. The Competitive Data solution crawls prices across 34 markets, processing 119 million data points monthly with 98% SLA and 2.5 million product matches per month. The Pricing Platform’s analytics layer tracks commercial outcomes against strategy targets at SKU, category, and portfolio level, with performance forecasting that generates projected outcomes before decisions are executed. Clients achieve a minimum 6% GM uplift in year one, with 50%+ of team time saved on repricing as the feedback loop between crawled market data and pricing analytics replaces the manual reconciliation between competitive monitoring and performance reporting that consumes significant pricing team capacity in organizations running the two as separate workstreams.
Price crawler software and pricing analytics software address the two ends of the same pricing decision cycle. Crawling provides the market data that informs what price to set. Analytics measures whether the price that was set achieved its commercial objective. Retailers who connect both into a single feedback loop make repricing decisions that improve in quality over successive trading periods, building demand knowledge that compounds rather than resetting with each new competitive challenge.